
BQChatbot
Natural Language BigQuery Interface
Ask a question about your data in plain English and get a validated query, an auto-selected interactive chart and a written answer, with cost guardrails, pinned dashboards and scheduled alerts built in.
- Role
- Sole engineer — design, build, deploy
- Timeline
- 2025
Why teams use it
- Anyone can ask. Business, operations and customer-success teams get answers without writing SQL or queueing for the data team.
- No surprise bills. Every query is dry-run first. If it would scan more than a set threshold, the user sees the estimated cost and confirms before anything runs.
- Safe by construction. Only a single read-only SELECT or WITH statement is ever executed. Anything else is rejected with a clear message.
- The right chart, automatically. The result’s shape decides between 11 chart types, from bar and line to combo, heatmap and map, and the user can switch with one click.
- Answers, not just charts. A second AI pass writes the headline, the narrative and the risks, quick wins, actions and anomalies hiding in the data.
- Consistent definitions. A semantic layer injects governed metric definitions into every question, so “revenue” means the same thing for everyone.
- From question to routine. Pin a chart to a dashboard, save a view, share a link, or schedule an alert to Slack or email.
All screenshots below use synthetic data: the company, categories and figures are invented.
Product tour
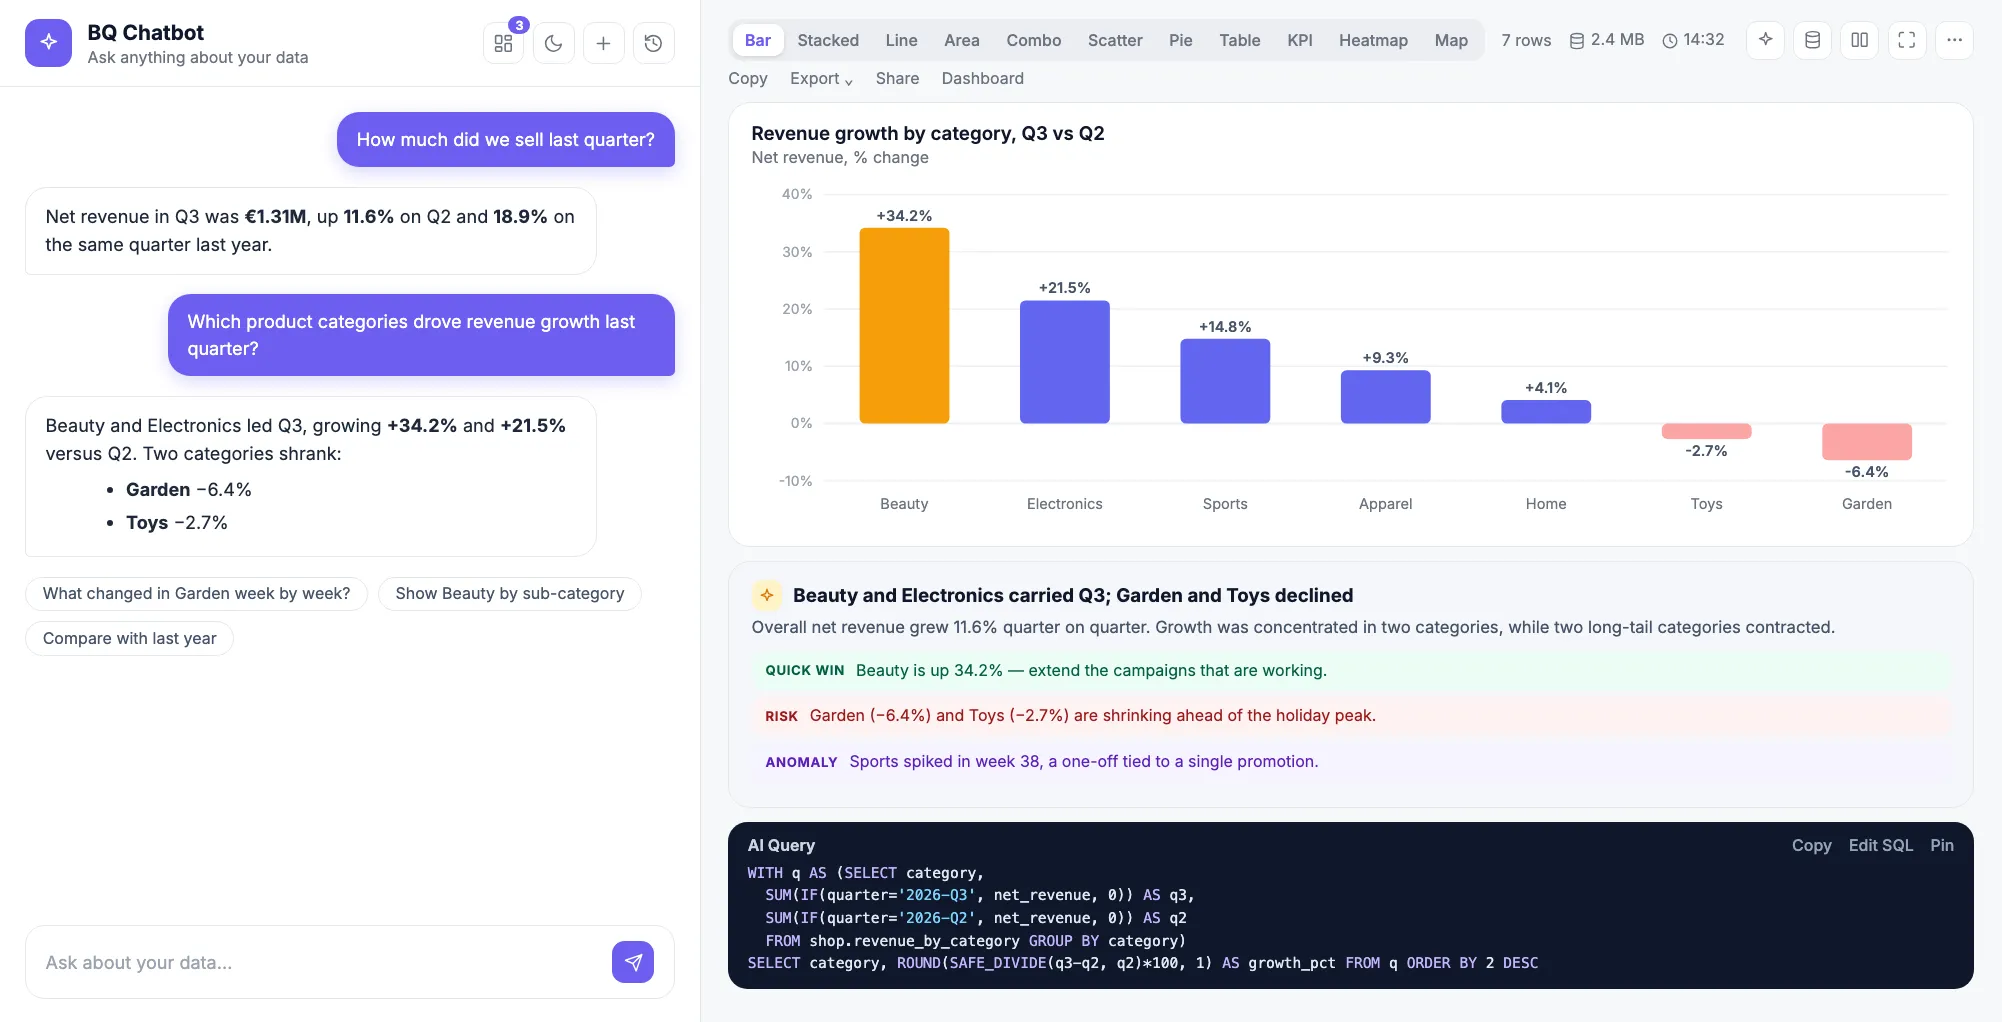
Ask, and get a chart plus the story
A plain-English question returns an auto-selected chart, a written answer, insights tagged as risk, quick win, action or anomaly, and the generated SQL for anyone who wants to check it. Follow-up chips keep the conversation going.
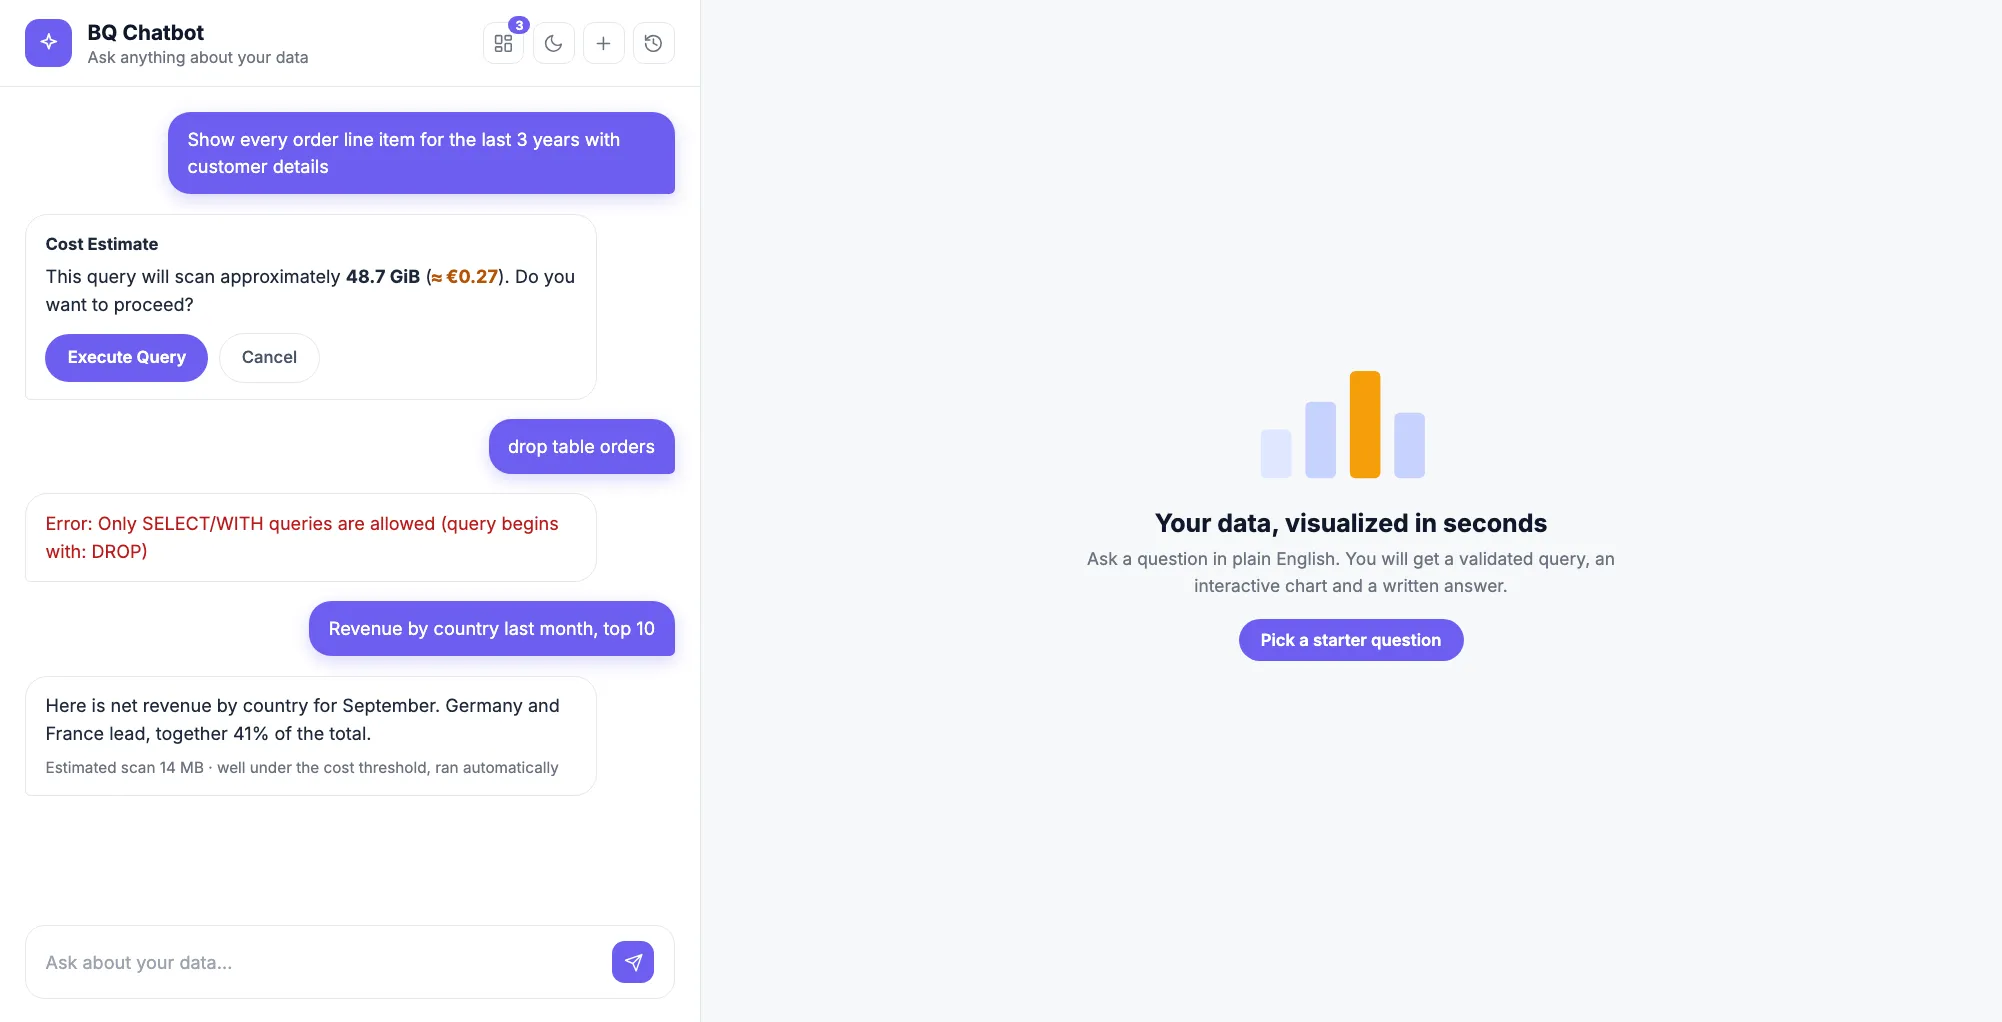
Guardrails you can see
Expensive queries pause for confirmation with an estimated scan and cost. Anything that is not a read-only query is rejected outright. Cheap queries just run.
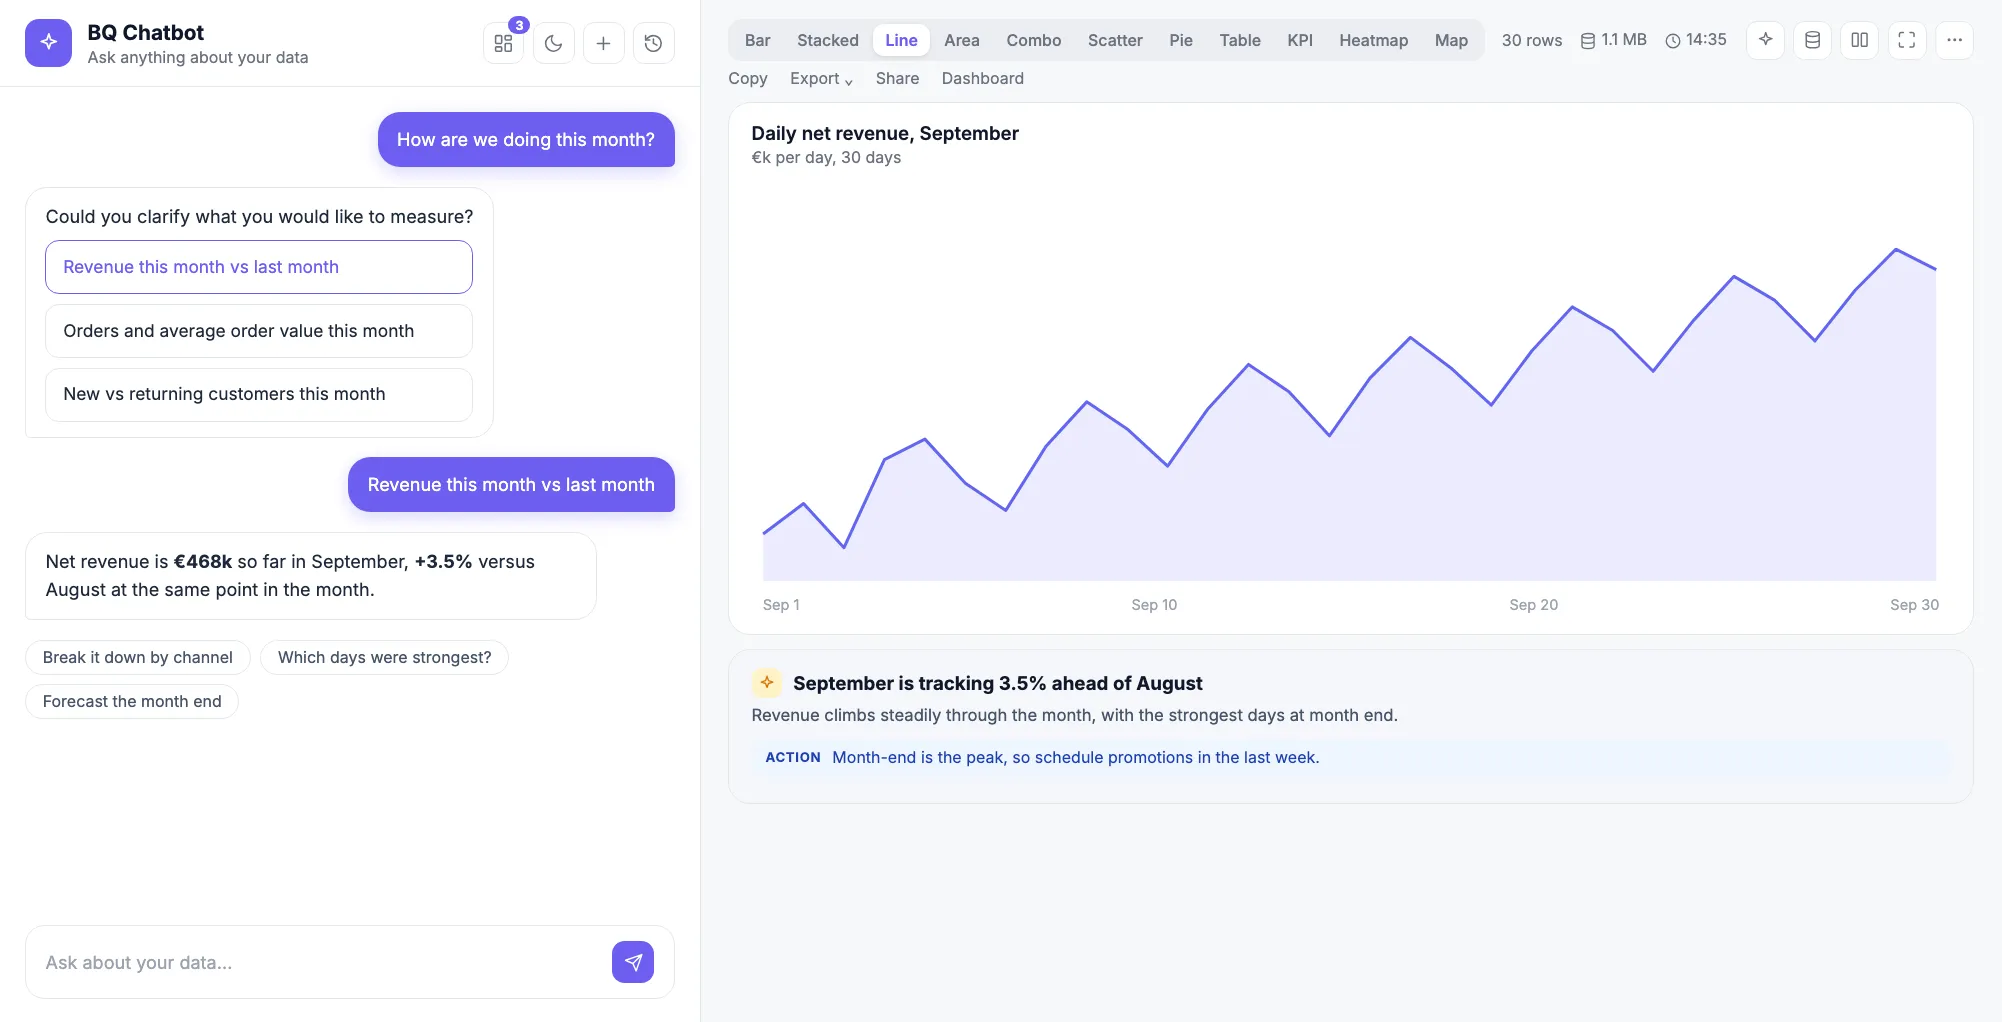
It asks when the question is ambiguous
Instead of guessing, the assistant offers restated options. One click picks the intended meaning, and the answer follows with an auto-selected line chart.
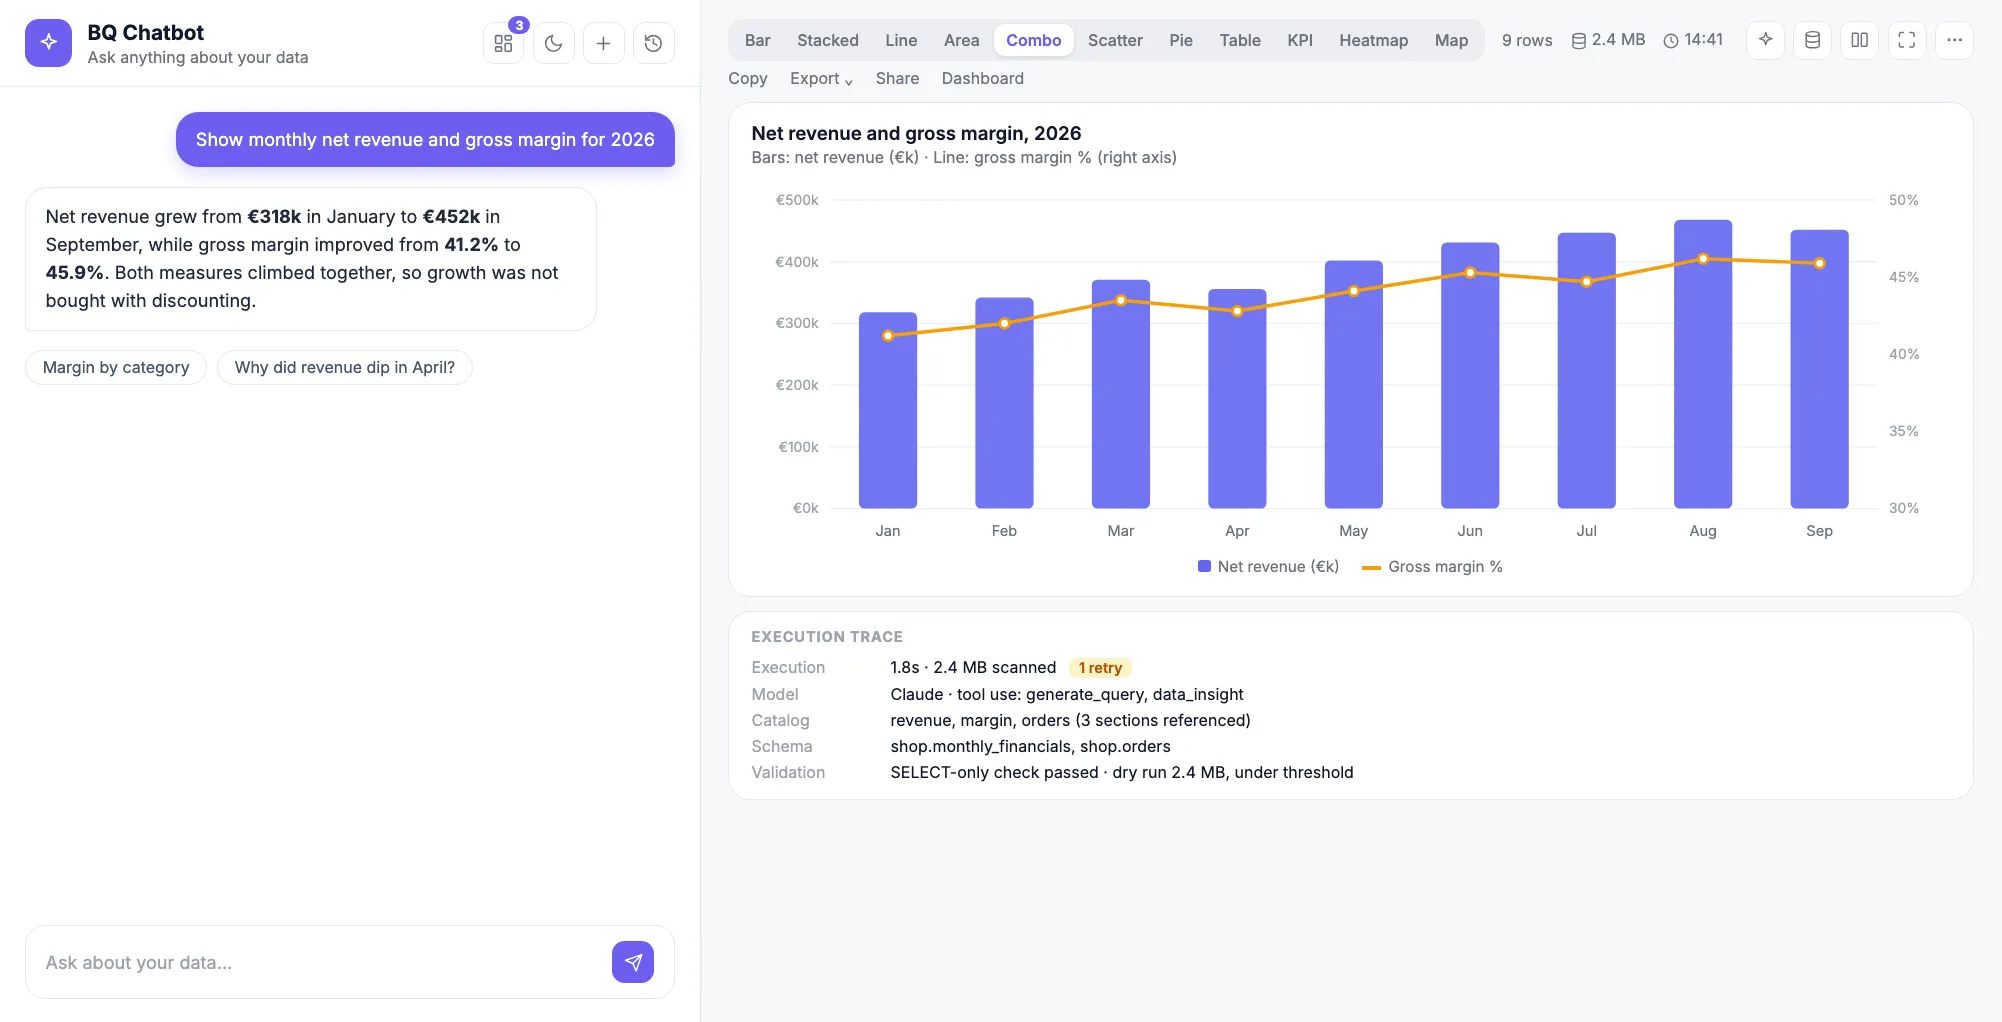
Charts that fit the data, with a full trace
Dual-axis combo charts, KPI cards, heatmaps and more, chosen from the shape of the result. An execution trace shows exactly what ran: time, bytes scanned, retries, catalog sections used and the validation outcome.
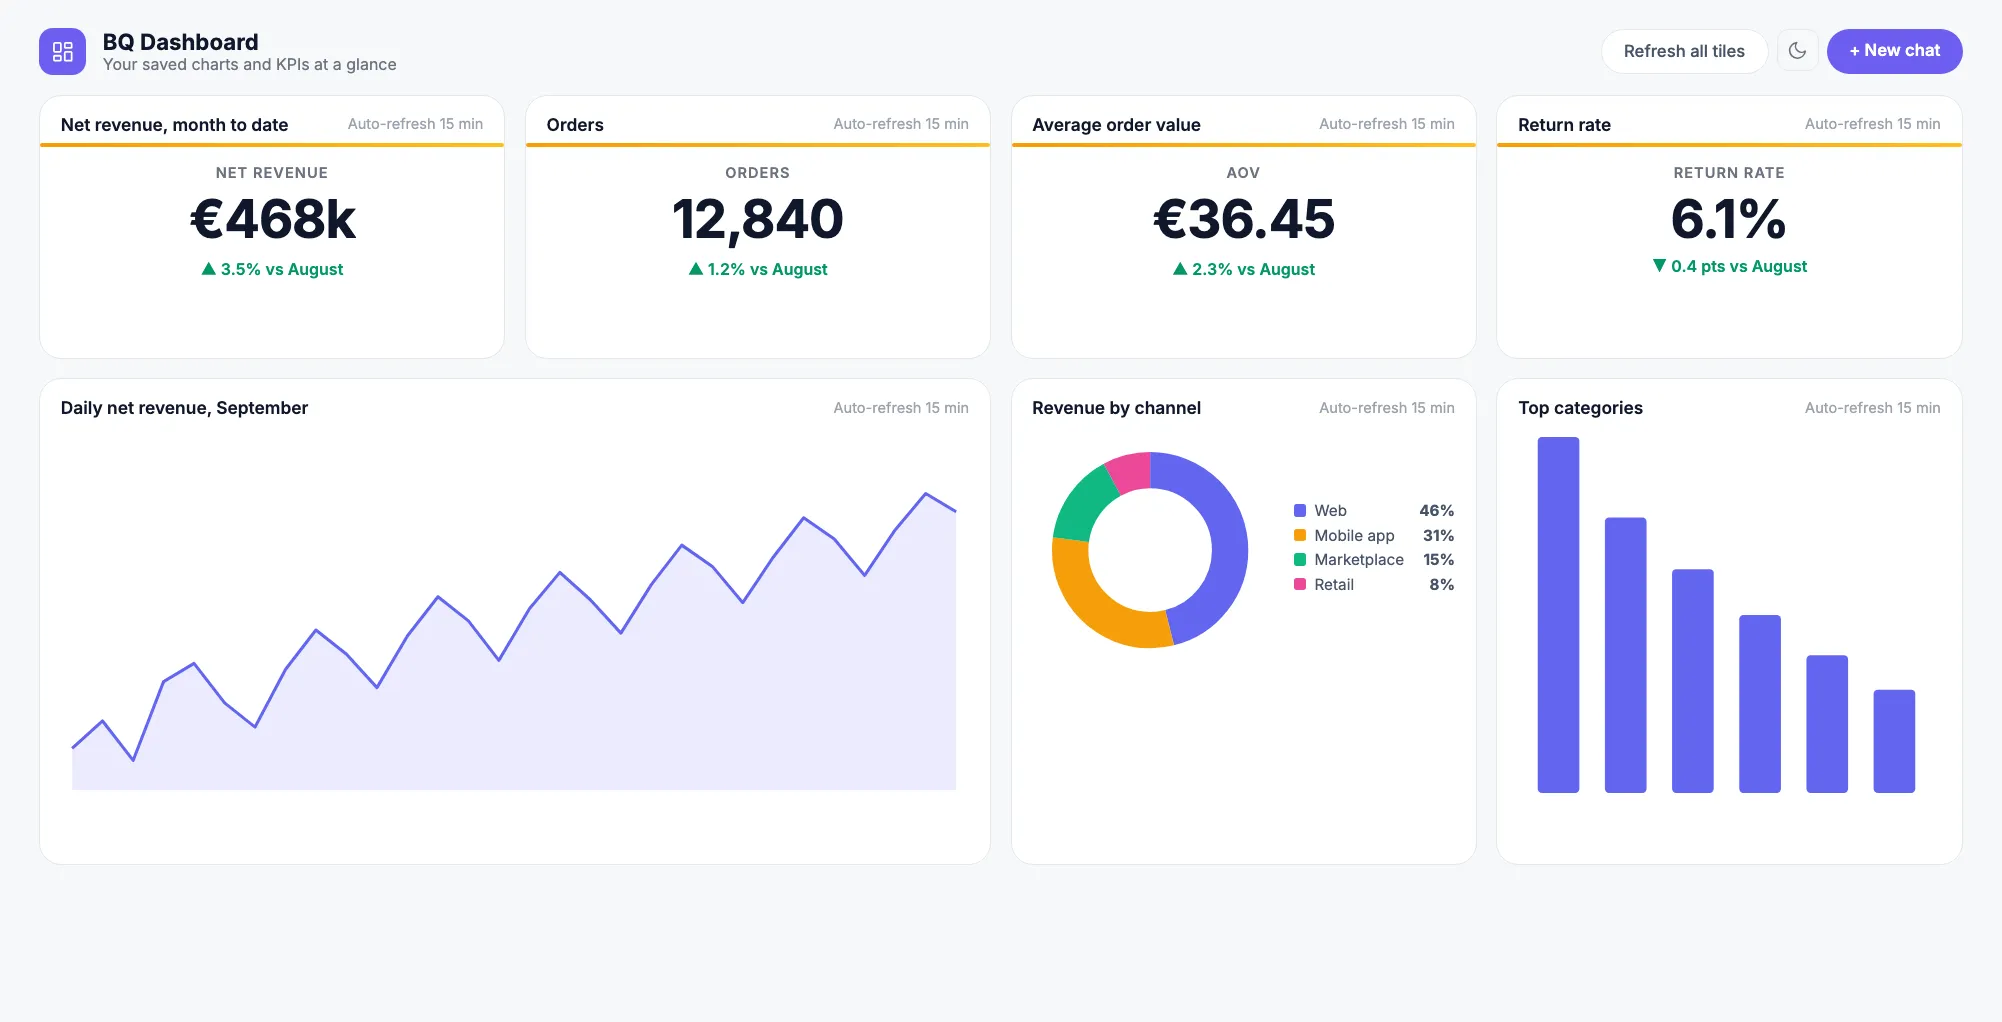
Pinned dashboards
Any answer can be pinned to a dashboard of live tiles in three sizes, refreshed on a schedule, with the same cost guard applied to every refresh.
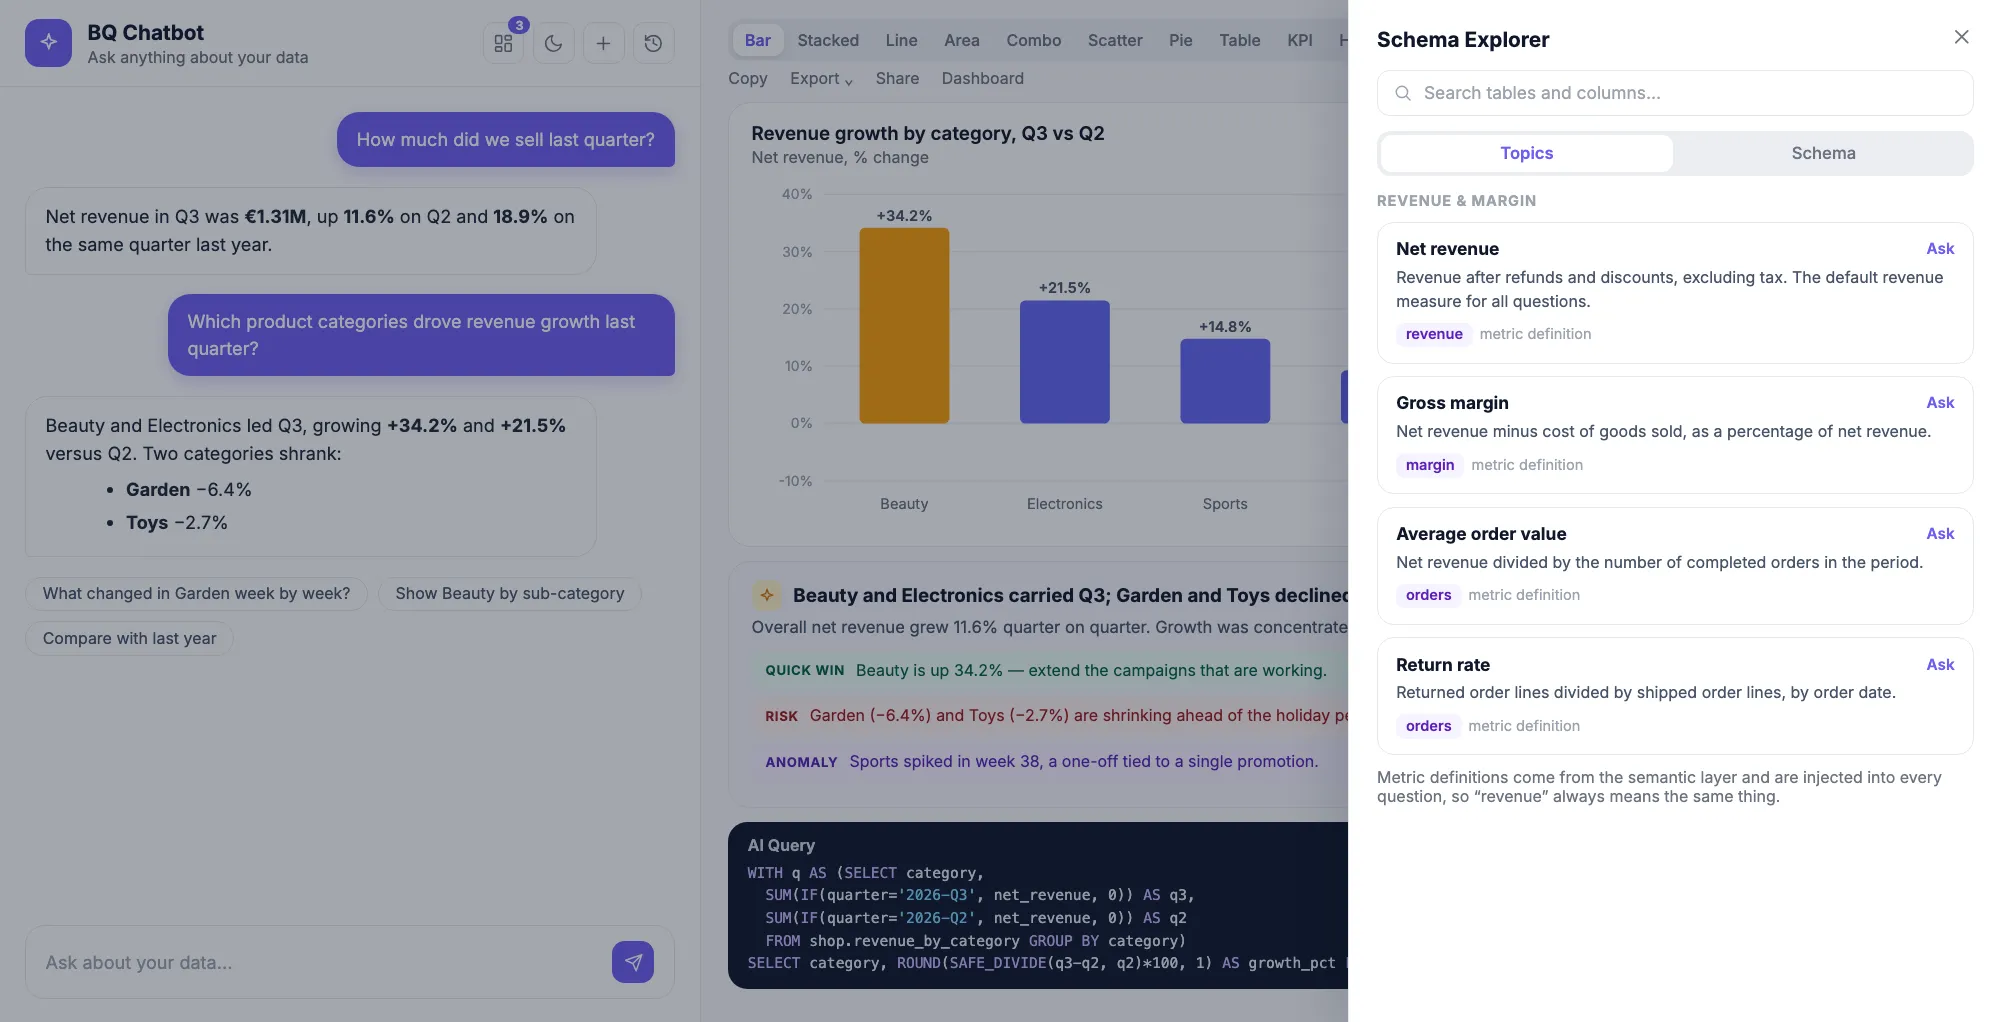
A semantic layer that keeps definitions consistent
Governed metric definitions are browsable by topic and injected into every prompt, so answers use the same meaning of revenue, margin or return rate every time.
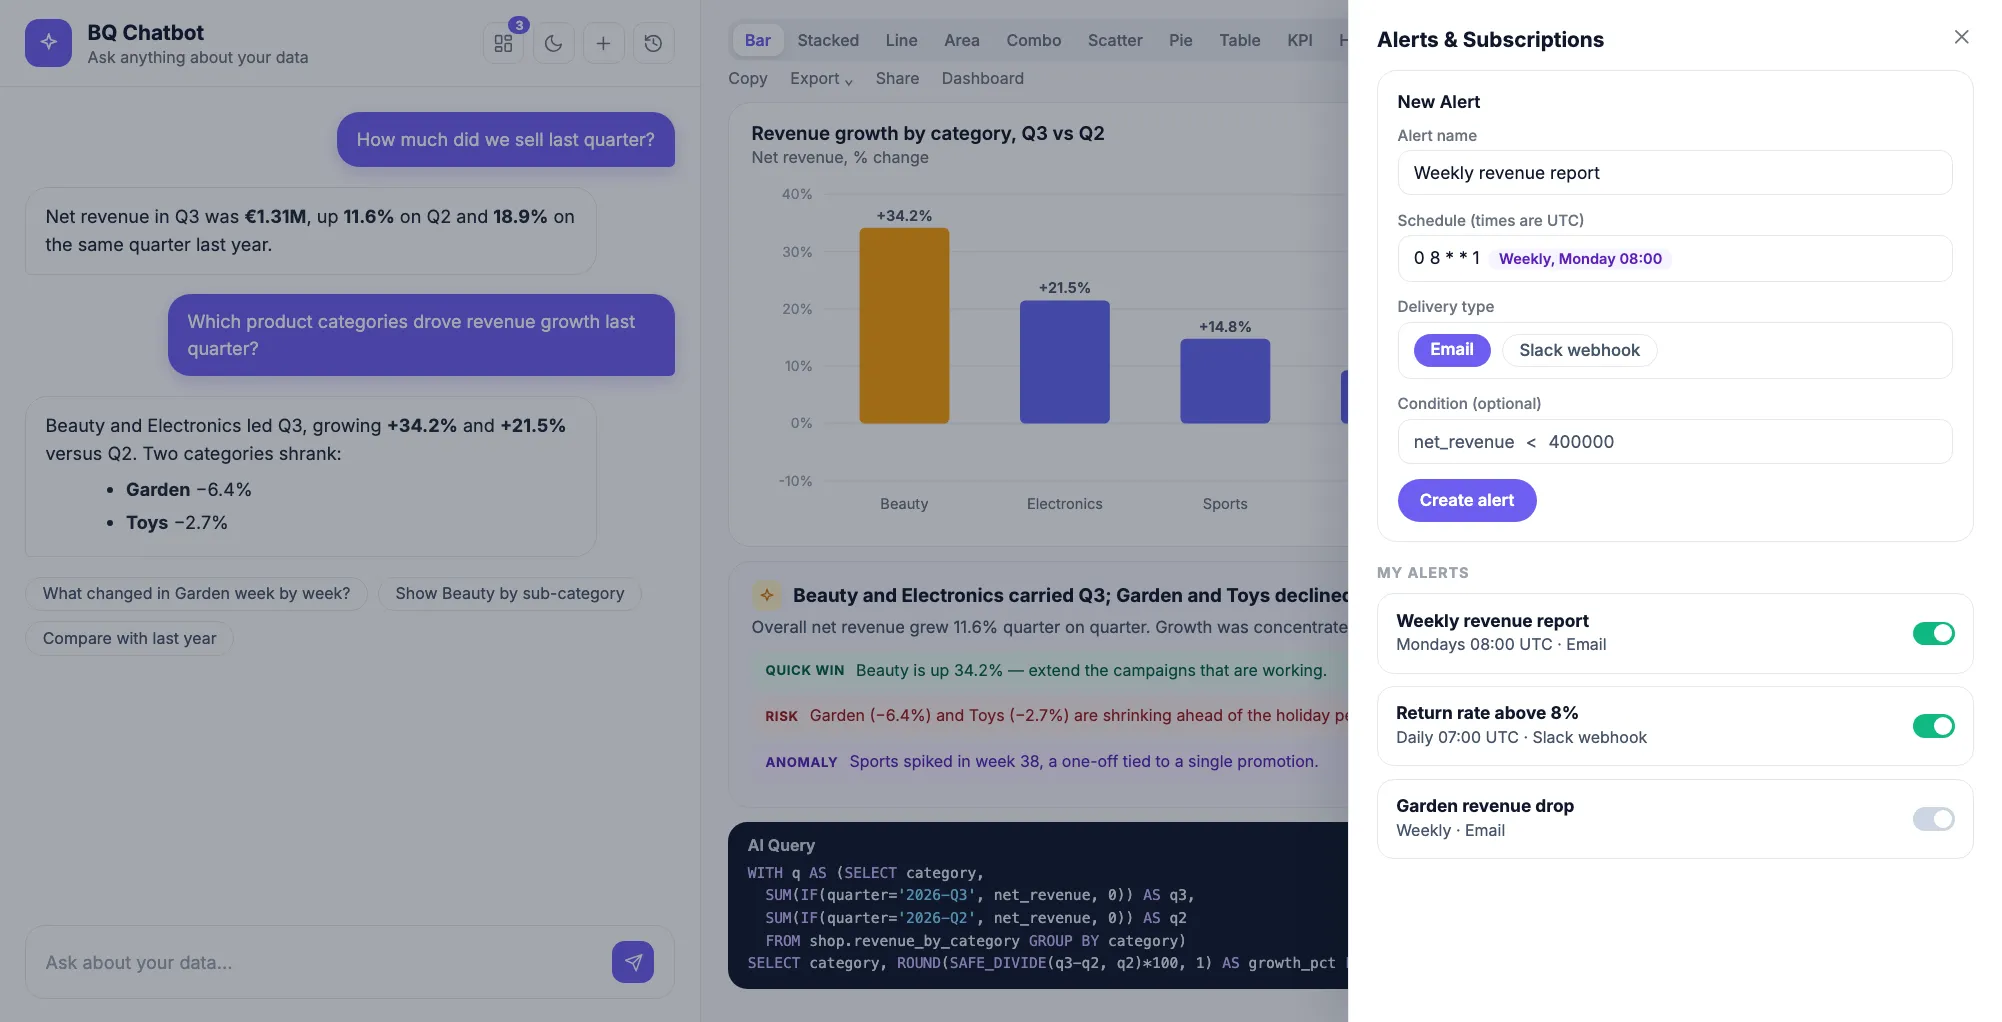
Alerts and subscriptions
Turn any question into a scheduled report or a threshold alert, delivered by email or to a Slack webhook.
How it works
- SQL generation via tool use. Claude generates BigQuery SQL grounded in the project’s catalog and schema, exposed through tool definitions. When the request is ambiguous it calls a clarification tool instead of guessing.
- Validate, then dry-run. Every generated query is parsed and restricted to a single SELECT or WITH statement, then dry-run against BigQuery. Over the cost threshold it waits for confirmation. If a query errors, the error goes back to Claude and the query is retried.
- Auto-visualization. Claude suggests a chart type and a rules layer validates or overrides it from the result shape: a single number becomes a KPI, a date with two measures becomes a combo, a long pie becomes a bar.
- Insight synthesis. A second pass reads the result set and writes the headline, narrative and tagged insights, and a third explains in plain language what the query does.
- Stack. React and Plotly on the front end, a Node.js backend, SSO for sign-in with saved views, pins, alerts and an audit log kept per user.
Results
- Plain-English questions become validated, cost-controlled queries with interactive charts in seconds.
- The dry-run gate means query cost is known before it is spent.
- Non-technical users self-serve, and the data team reviews conversations instead of writing one-off SQL.
What I’d do differently
Invest in the curated semantic layer (metric definitions, blessed joins) even earlier. Schema-grounded generation works, but generation grounded in business definitions is what makes answers trustworthy enough for executives.