
DataPulse
AI-Powered Data Platform Monitor
One console for the health, cost and change of a data platform: cross-service incident correlation, on-demand AI root-cause analysis, schema-change impact and cost recommendations across BigQuery, Kubernetes, dbt, GitHub and more.
- Role
- Sole engineer — design, build, deploy
- Timeline
- 2025
Why teams use it
- One console for the platform. Warehouse jobs, Kubernetes workloads, dbt runs, deploys, streams and tickets in a single view, with an overall health score.
- Failures arrive with context. Events from BigQuery, dbt, Datastream and Kubernetes are stitched into correlation chains with an inferred root cause, instead of five tabs and a guess.
- AI root-cause analysis on demand. For any incident, the relevant dbt runs, Kubernetes events, freshness checks, anomalies and open incidents are gathered and analysed into a likely cause, contributing factors, a suggested fix and similar past incidents.
- Know what a change will break. Schema changes are detected from DDL, rated safe, warning or breaking, and traced to the downstream models they touch, with column-level lineage and blast radius.
- Spend you can act on. Cost by service with budget and forecast, plus a query advisor that flags anti-patterns such as
SELECT *and missing partition filters with estimated weekly savings. - A real incident lifecycle. Declare, acknowledge, resolve and measure time to resolution, with alerts that can forward to an incident-management tool.
All screenshots below use synthetic data: names, numbers and queries are invented.
Product tour
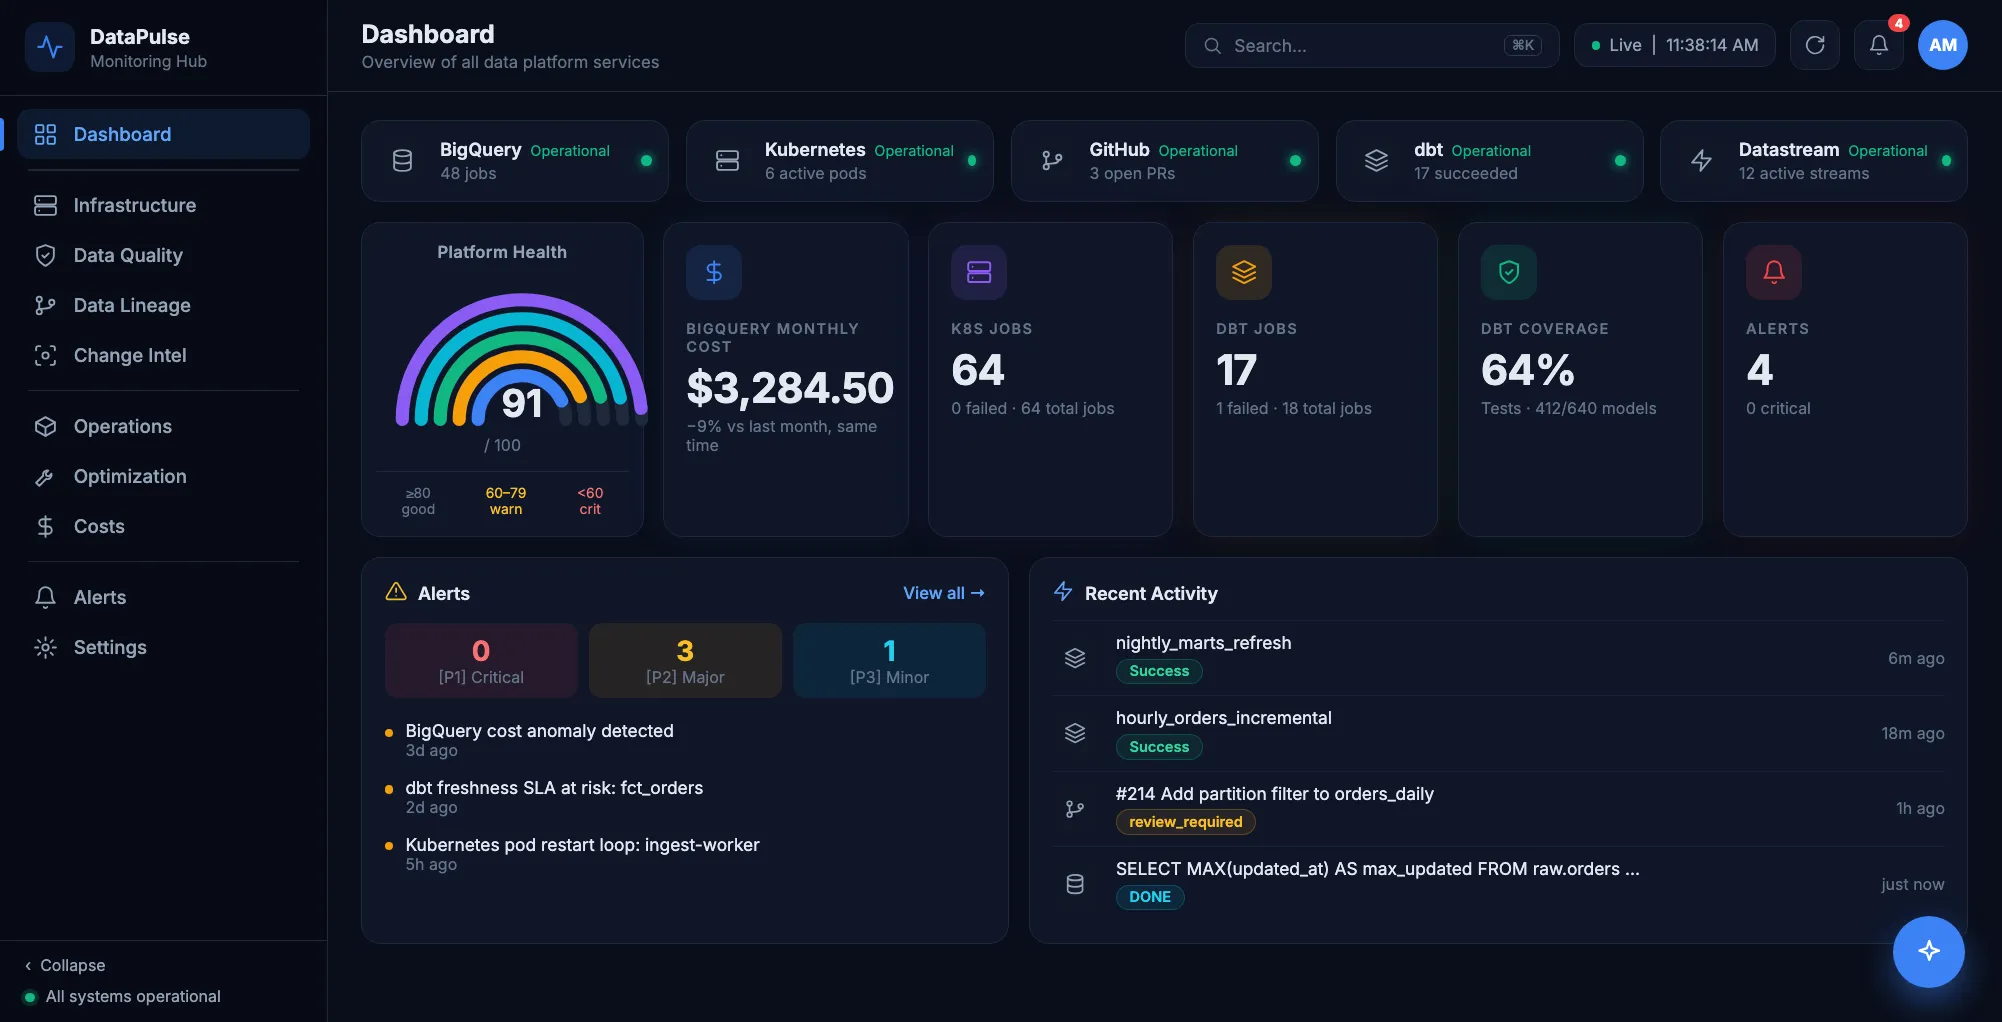
Platform health at a glance
Service status, a platform health score, warehouse cost, job counts, test and documentation coverage, alerts and recent activity on one screen.
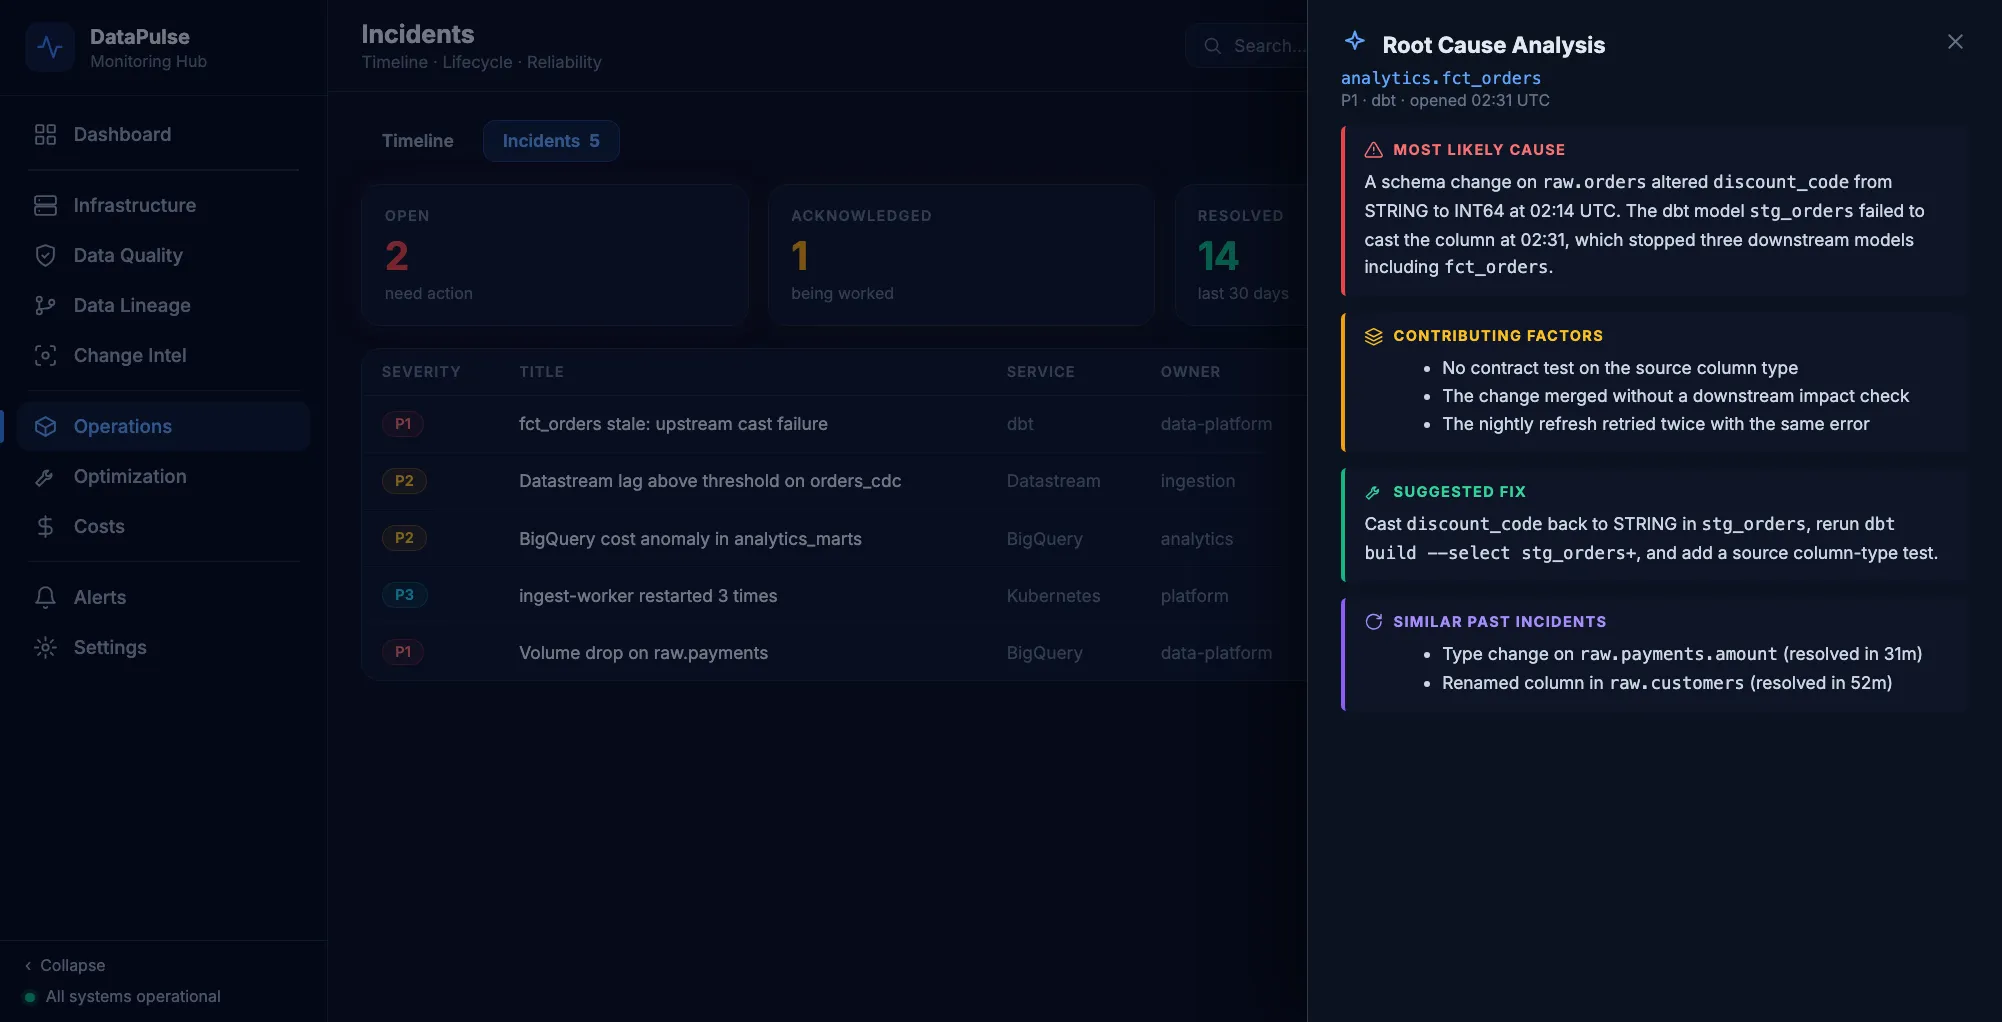
Root cause, explained
Open any incident and ask for a root-cause analysis. The drawer returns four sections: the most likely cause, contributing factors, a suggested fix and similar past incidents.
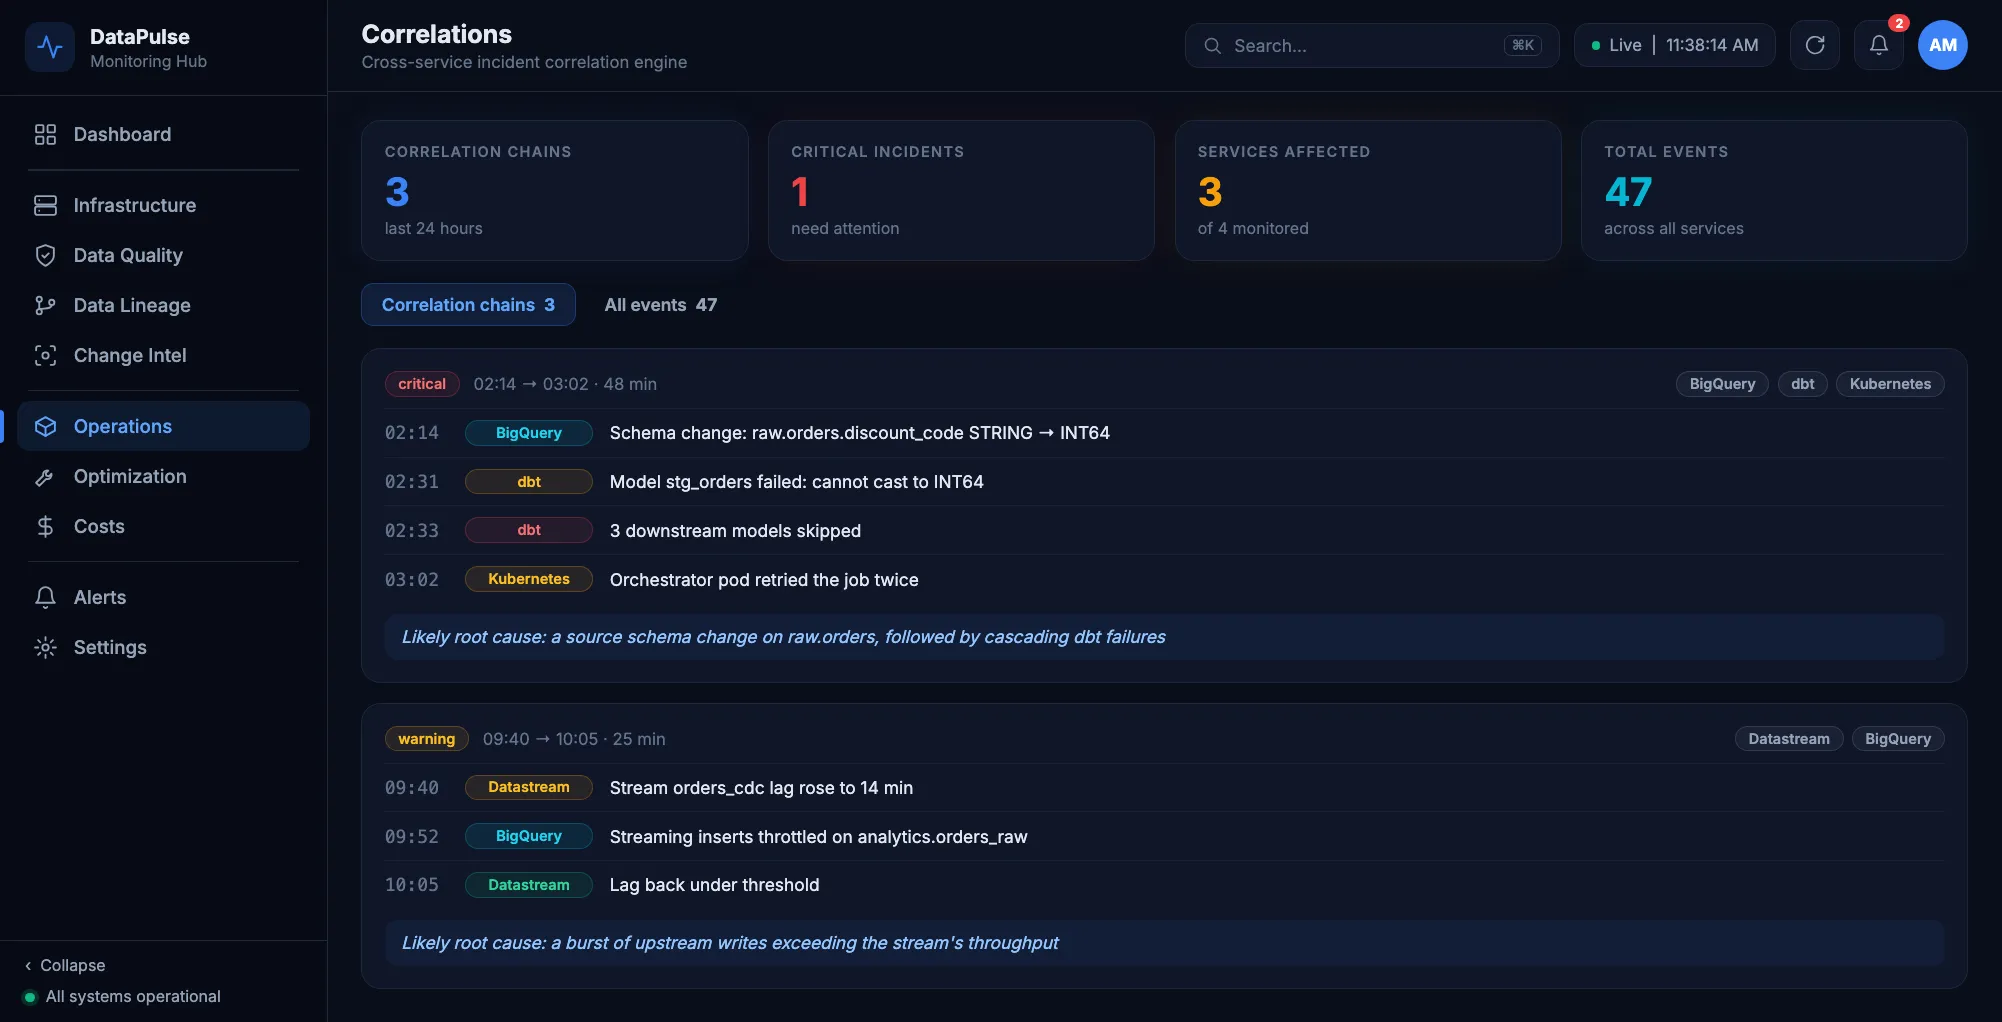
Events connected across services
A schema change, a failed model, skipped downstream models and an orchestrator retry are shown as one chain with the inferred root cause, rather than four unrelated alerts.
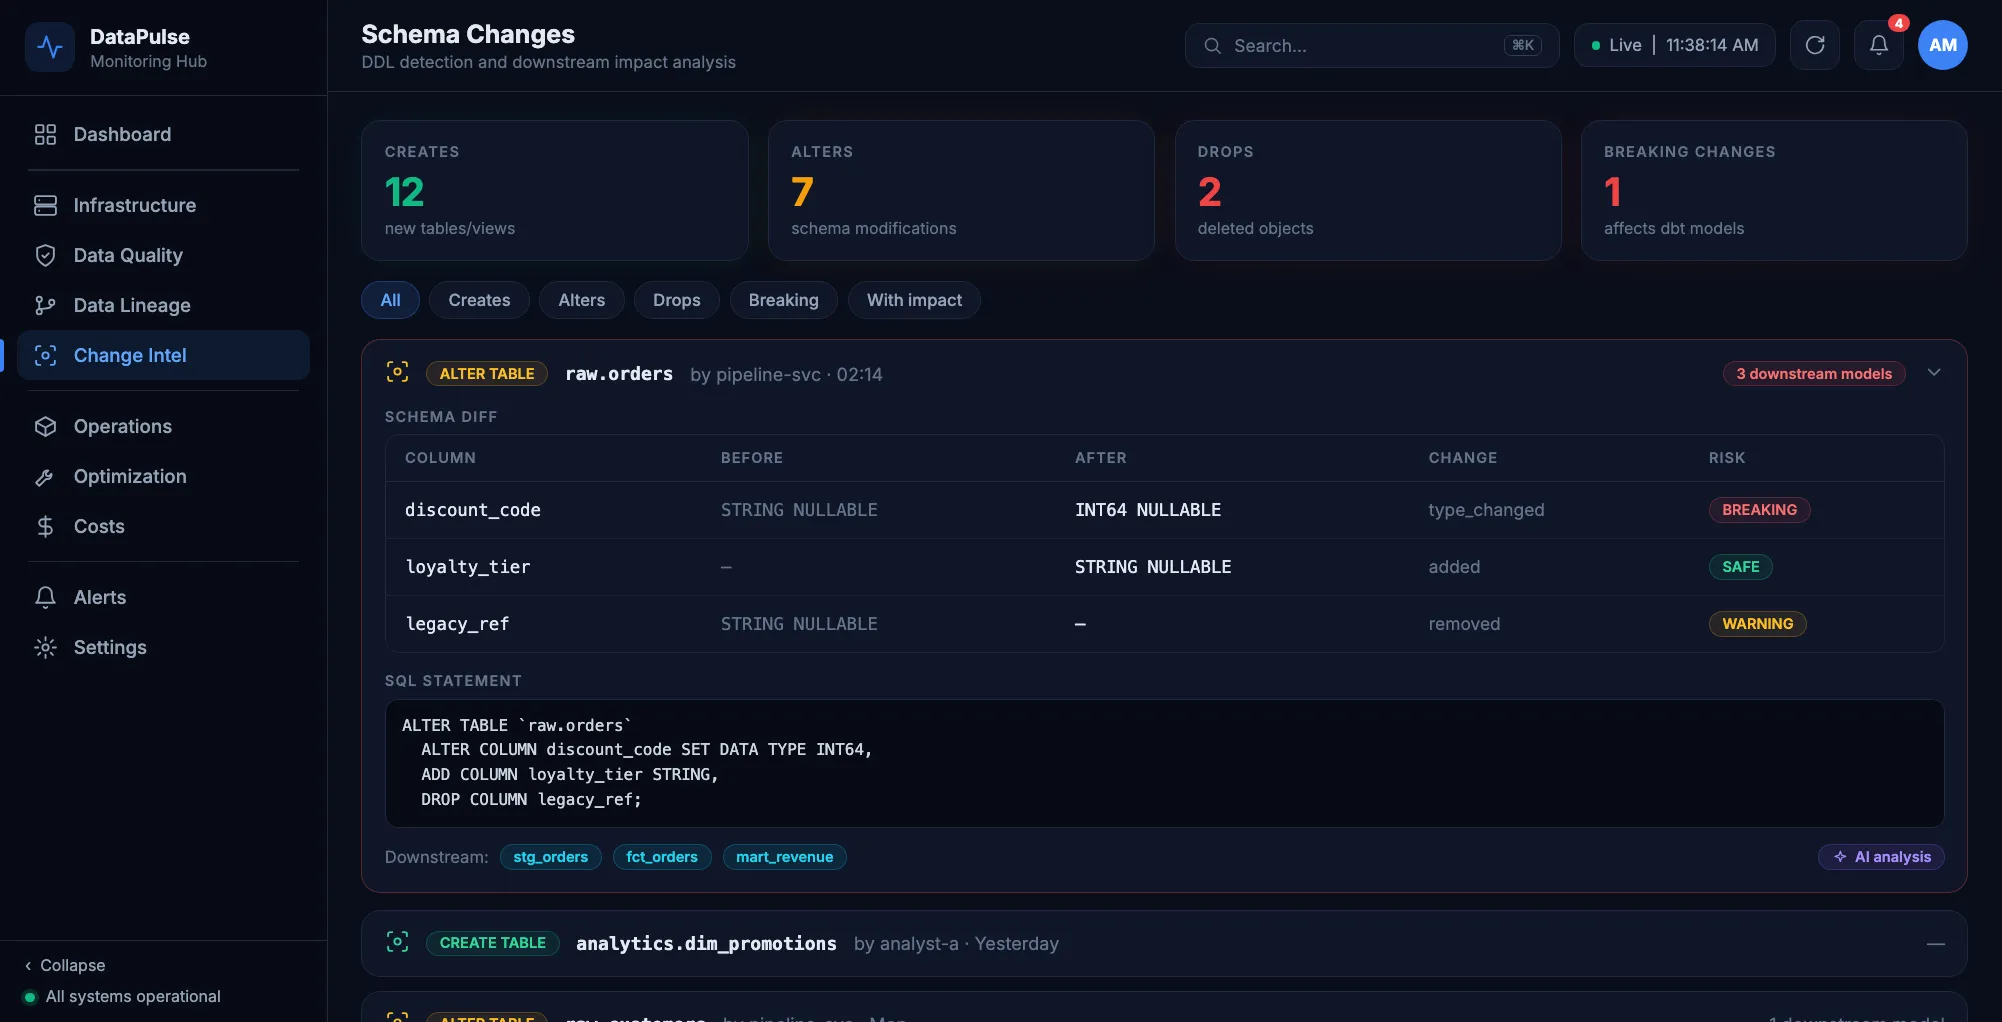
Schema changes with their impact
Every column change is classified and the downstream models are listed before anyone is surprised in production.
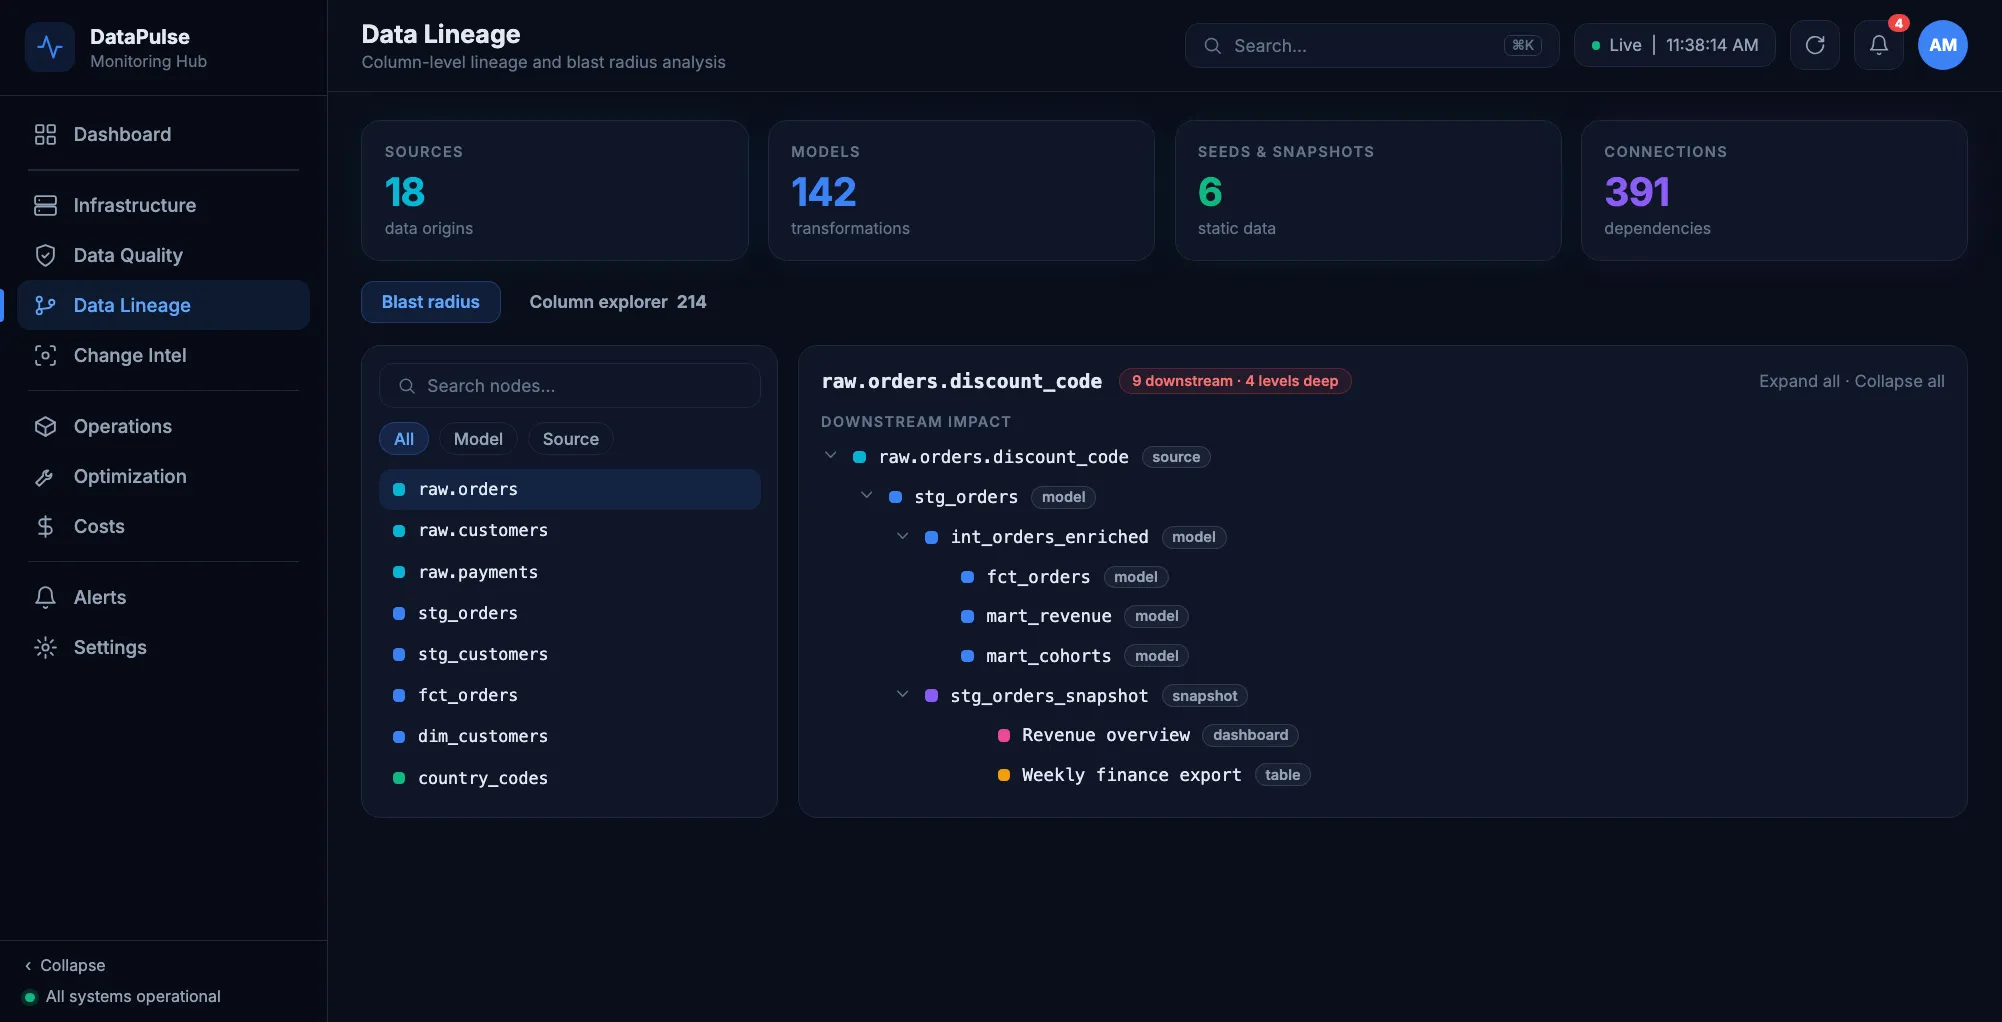
Blast radius, down to the column
Pick a column and see everything downstream of it, how many levels deep, and what kind of object each one is.
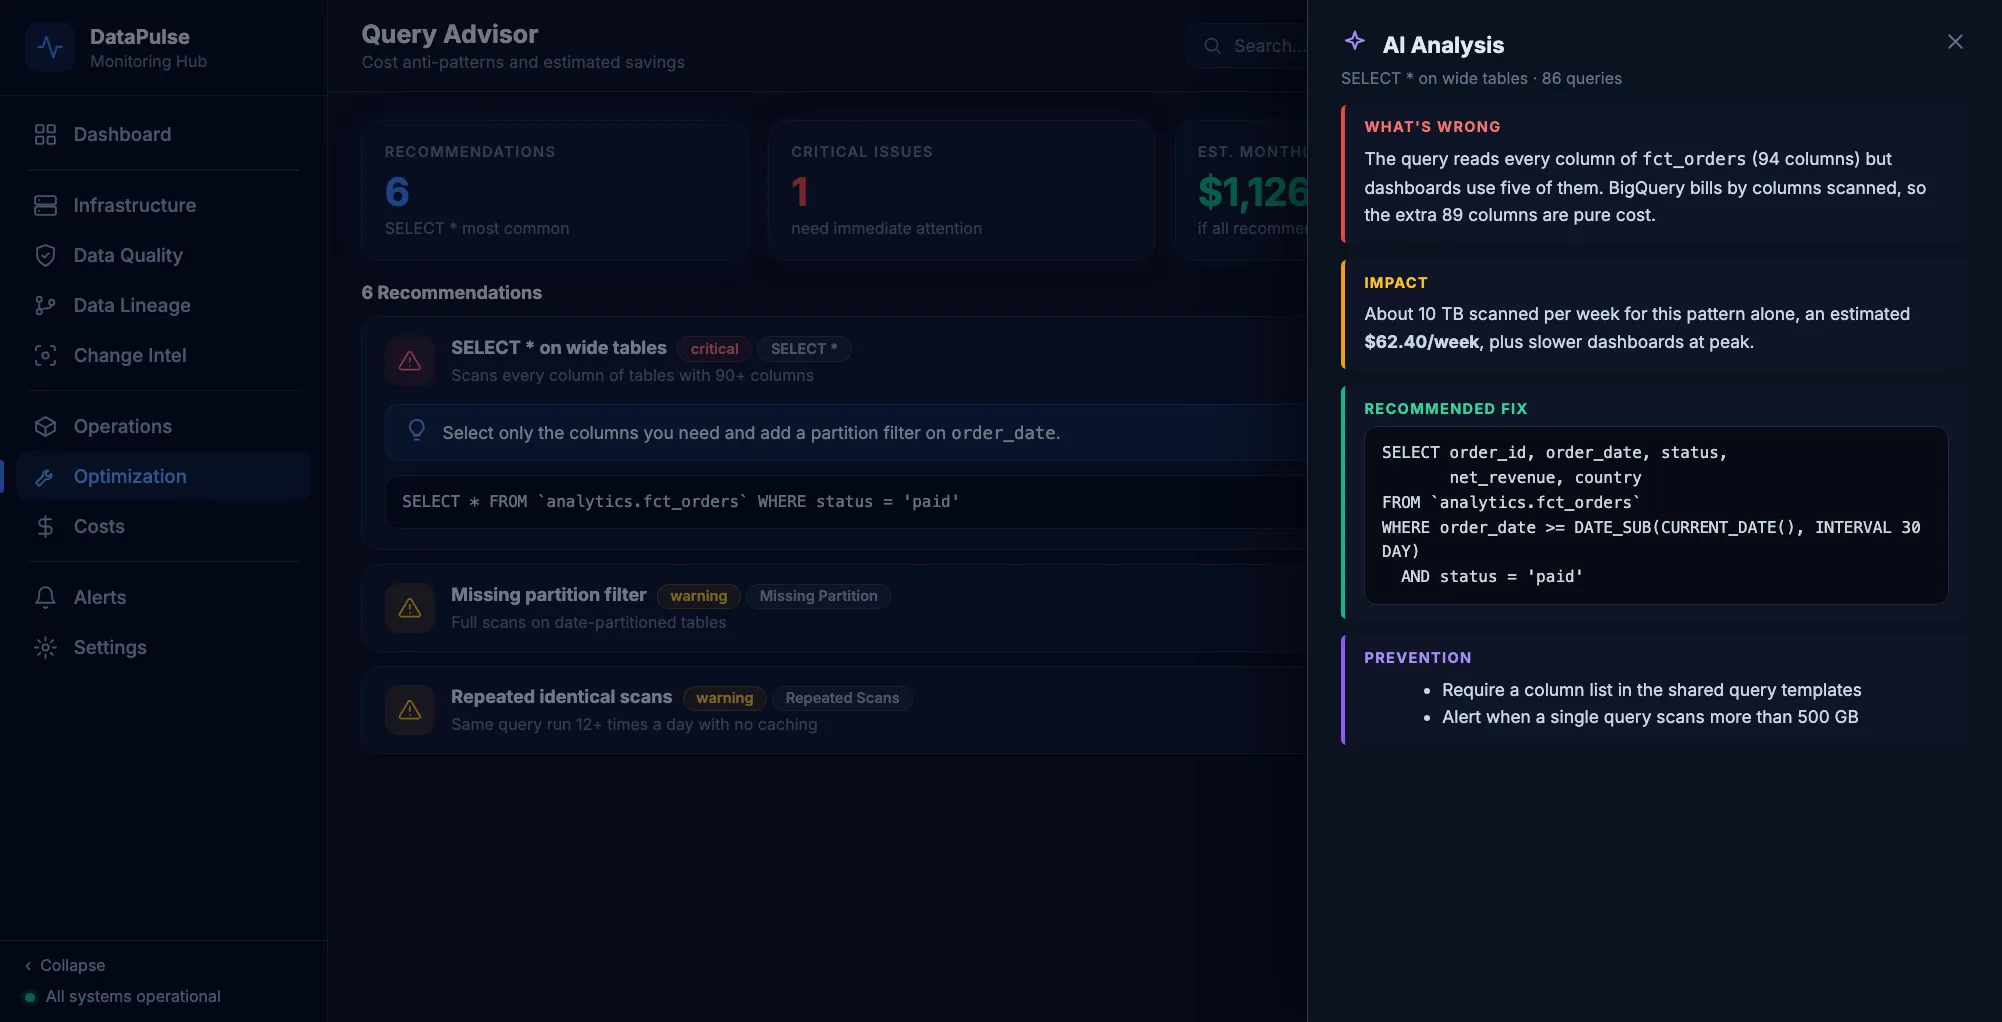
Cost recommendations with a price tag
Anti-patterns are ranked by severity with the queries behind them, an estimated saving per week, and an AI explanation of what is wrong and how to fix it.
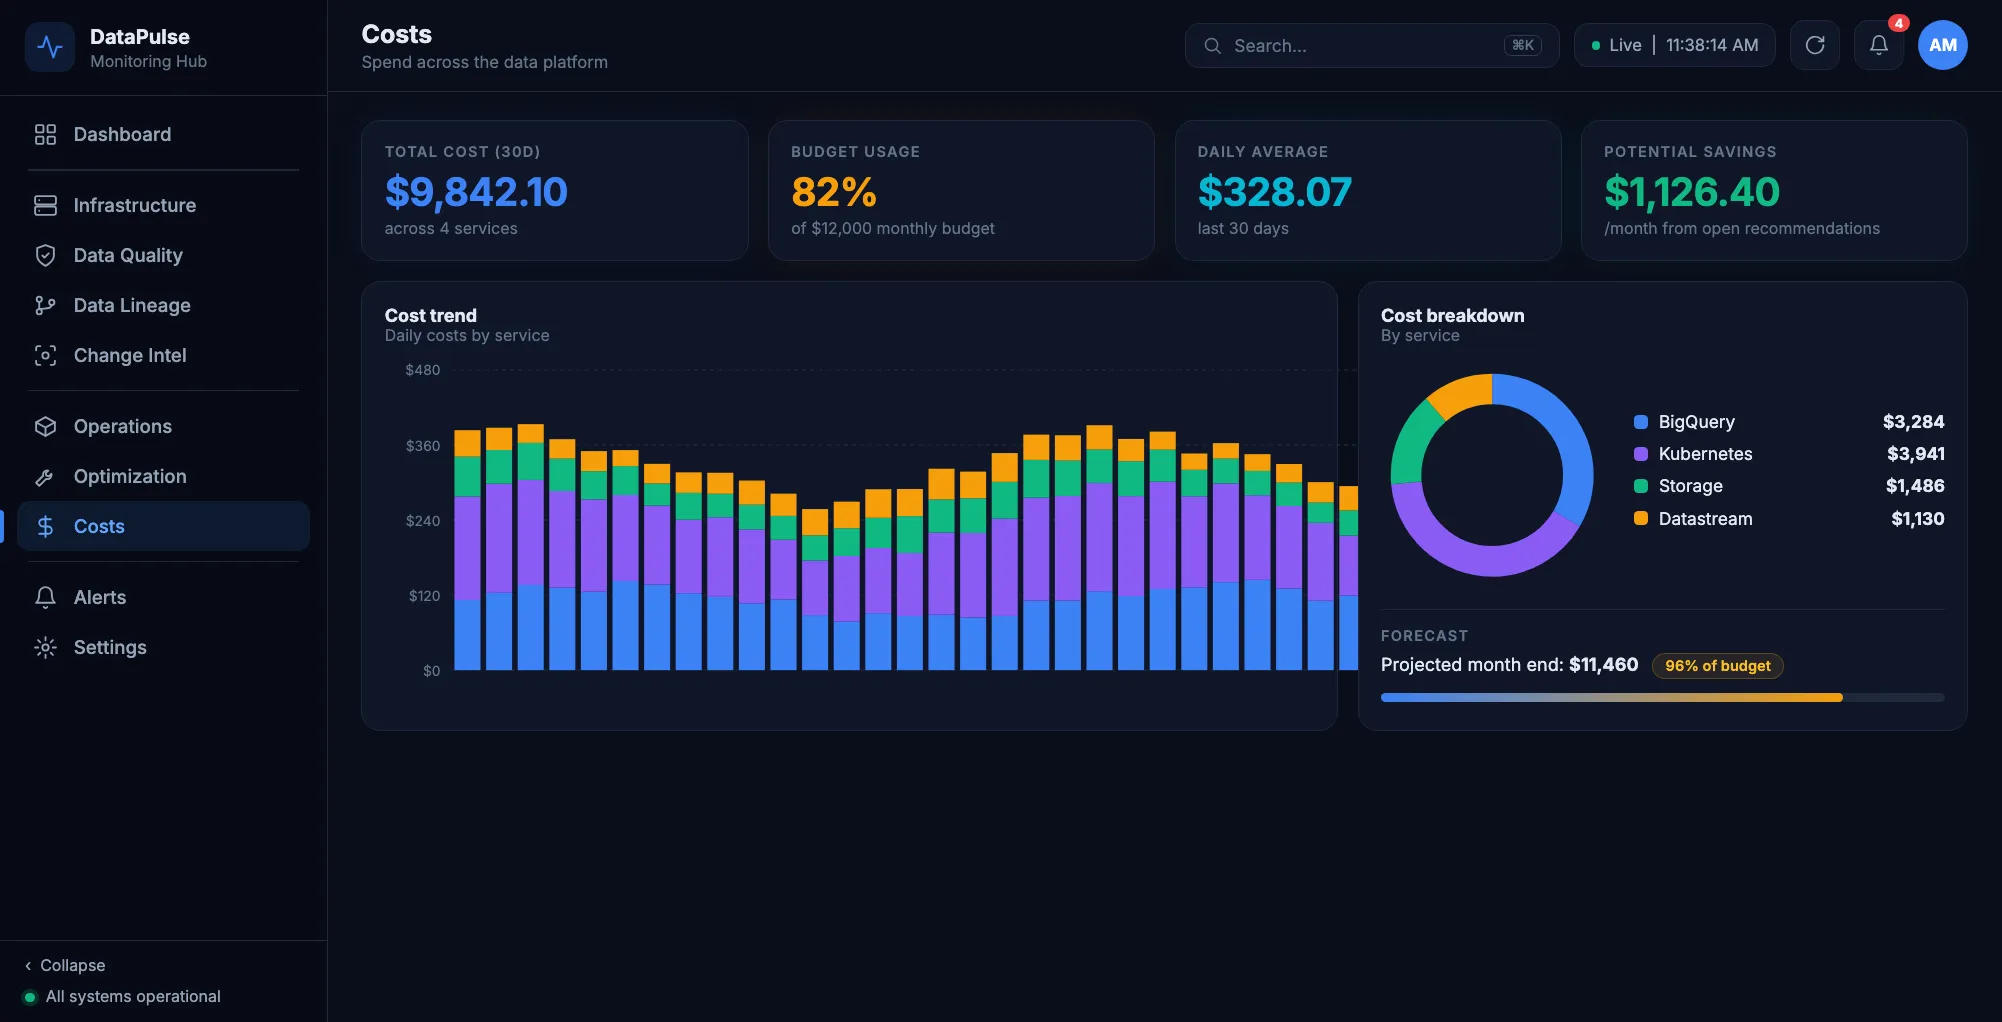
Spend, budget and forecast
Daily cost by service, the breakdown, budget usage and a month-end projection.
Under the hood
- Front end and API. A Next.js and React application with Tailwind and Recharts, backed by more than 40 API routes, with role-based access for write actions.
- Integrations. BigQuery, Kubernetes, GitHub, dbt Cloud, Datastream, Jira, PostgreSQL publications and incident.io, plus Claude for the AI features.
- AI analysis. Each analysis runs on demand against gathered context rather than raw logs, which keeps prompts small and answers grounded. Each feature has its own structured sections, for example what’s wrong, impact, fix and prevention for a query.
- Operator experience. A command palette, live status, and a floating assistant for questions about the platform.
Results
- Platform health, incidents, schema changes, lineage and cost are reachable from a single console.
- Incidents can be analysed with the relevant evidence already gathered, instead of assembled by hand.
- Cost anti-patterns surface with estimated weekly savings attached.
What I’d do differently
Start with the lineage model earlier. Correlation quality is bounded by how well resources are linked across systems, so building column-level lineage first would have made the first iterations of AI analysis sharper.